|
|
|

Home | Current Issue | Editions | Archives | Contact Us
VOL-II, ISUUE-I (Spring 2009)
PORTRYAL OF VOILANCE AGAINST WOMEN IN PTV
DRAMATIZED PROGRAMS
Robina Roshan
Muhammmad Aslam Parvez (PhD)
Syed Abdul Siraj (PhD)
ABSTRACT
The present study examines the prevalence of violence against women in the prime time PTV Urdu drama serial telecasted during first quarter of 2004. The studies explore Different types of violence against women as portrayed in the context of ratio per hour.
It was hypothesized that higher the prevalence of violence, higher will be the prevalence of verbal and psychological violence. The study analyzes univariate frequency distribution as well as Signorielli C.I model (1980) for testing the hypothesis. The finding is reflective from the stand point of cultural Indicator theory as well as massage content analytical literature on media fare. The study reveals that PTV overall telecast 332 violence scenes with 764.44mts duration.
The finding reveals that the dramatized TV programs portrayed all the four types of violence i.e., verbal, physical, psychological and symbolic violence against women. The ratio of psychological violence was high i.e. 31.43% than the verbal violence of 18.66%. While the ratio of physical and symbolic violence was i.e. 0.21% and 1.07% respectively.
INTRODUCTION
The new media distinctively associated with the19th and 20 th centuries___ the press, radio, and television, the cinema and the record industry___ have traditionally been grouped together under the heading mass media.' Williams, R. (1977) stated that among all these, television is a centralized system of storytelling. Its dramas commercials, news and other programmes bring a relatively coherent system of images and messages to everyone.
After the introduction of Television in Pakistan it captures the attention of public. And more rapidly adopted by the peoples. Pakistan Television provides lot of informational, educational beside entertainment. Through five main Television stations: Islamabad , Karachi , Lahore , Quetta , and Peshawar . PTV dramas highlight various social issues. During the year 2001 total 688 drams are produced and 486 drams were telecasted.(FBS report 2003). These reflect the social norms and values of Pakistani society. Televised representations of social realities reflect ideological bents in their portrayal of human nature, social relations, and the norms and structure of society (Adoni and Mane 1984).
Gerbner (1970) stated TV situations are based on real life experience . TV's constructed mediated reality picture a world that is funnier, sexier, bolder, more violent and more intense than our own.
This study explores the prevalence and the extent of the different types of violence i.e. physical, psychological, symbolic and verbal violence against women in PTV fictional world. "There is presently little evidence indicating that violence enhances program popularity" (Diener & DeFour, 1998). This paper focused on PTV prime time dramas, because PTV has become the primary channel of entertainment in our society. (by prime time we mean the transmission hours from 8 pm to9 pm).
Public attitudes regarding the role of women in society are major determinants in deciding the status of women, In shaping these attitudes the media exert a strong influence. There has been a growing rate of violence against woman from past few years. Data published in Human development in south Asia 2000, shows that in 1997 total 176 cases of honor killing reported in 6 months, of which 70% of the victims were women.
A report published in daily The Nation and daily Nawa-i-Waqt of 28th December 2002, prepared by an NGO, present the worse situation. Which shows that, in Pakistan more than 2,500 women and 400 men were murdered during the year 2002 in the name of honour killing (Karo-Kari)? There is need to analysis media contents and evaluates that how much it depicts aggression and especially aggression towards the women. And therefore the present study is under taken with the primary objective of exploring the magnitude and nature of violence against women.
It is hypnotized that if the PTV Urdu dramas have a greater ratio of violence the ratio of verbal and the psychological violence will also be greater. In Pakistan , it is first attempt. That for the first time this paper has convincingly displayed the heuristic value of applying Signorielli cultural indicator model (1980) for testing the studies hypothesis and analyzing the data.
THEORATICAL FRAMEWORK
Theory is an attempt to explain a particular phenomenon. This study is theoretically linked to the work of cultural Indicators (C.I) group active at the Annenberg school of communication. Cultural indicators are historically grounded, theoretically guided and empirically supported (Gerbner, 1969, 1970, 1972a).In the CI project the early efforts focused on the native and functions of television violence. Even violence was found to be primarily a demonstration of power in the world of television, with serious implications for social control and for the confirmation and perpetuation of minority status as well as for disruption (Gerbner, Gorss, Signorielli, Morgan, and Jackson Beeck, 1979; Morgan, 1983).
The Cultural indicators approach involves a three-pronged research strategy. The first prong called institutional process analysis is designed to investigate the formation of policies directing the massive flow of media massages. The second prong call message system analysis and the third call cultivation analysis. The present study is based on the second prong in this prong in 1967 recorded annual week long samples of U.S network television drama and subjected these systems of messages to content analysis in order to reliably delineate selected features and trends in the world that TV presents to its viewers. Our content analytical study is based on this cultural indicator model. So it is message analytical investigation of PTV Urdu dramas telecasted during 1st quarter of 2004 .
RESEARCH QUESTIONS
• How much and to what extent violence against women is being depicted through the PTV dramatized world?
• What is the nature of violence against women?
METHEDOLOGY
Research Design
In this study content analysis research design was employed this design was felt appropriate to study the ratio (frequency) and the rate (duration) of violence against women as portrayed by PTV.
Sampling
For the present research work we have selected prime time Urdu drama serial through the purposive sampling technique. One-quarter Urdu dramatized entertainment during PTV prime time transmission on national hook up for the month of January to March 2004 telecasted was included in the sample.
Unit of Analysis
Two unit of analysis instruments i.e. a) the program and b) the violent incident was used to measure the nature and ratio (frequencies) of violence in the different programs (Robinson 1972 Anne 1994 Georg Gerbner 1979).
Specifically, in this study all observations were recorded, among others, in two types of recording unit, the program and the violent incidents. Violent incident is defined as one restrained dramatically continuous event involving violence with essentially the same group of participants without change of roles and with no major interruption in continuity (Raney et al 2002, Bogart 1958).Violence is defined in the study of Gerbner et al (1969) as the overt expression of physical force with or without weapon against self or others compelling action against one's will on pain of being hurt or killed or actually killing or hurting.
Our present research study broader this definition by classifying it as verbal, physical, psychological, and symbolic violence. By verbal violence we mean; using harsh wording, using word abuses and using loud voice, by physical violence mean beating with hands/ legs/stick/ slapping/ using weapons/any other, pulling pushing and acid burning, by psychological violence we mean giving depression or torture directly or indirectly, by symbolic violence we mean gazing, gesturer using facial expression, expression of beating but not actually beating.
Anne 1994; George Gerberg 1992, French 1992 as in the CI project Gerber and Gross et al 1970, 1979, 1980) propounded an index for violence measurement which is based on two data sets: a) Prevalence and b) rate.
a) Prevalence (%P) is the percentage of programs in a sample containing violence rate expresses the frequency of violence in units of programming (R/P) which is the number of violent incident divided by the total numbers of programs containing violence.
b) Rate per all hours (R/H) was the number of violent incidents divided by the number of program hours in the sample The CI violence index is measured with this model of signorielli 1980 et al): PS = %P+2(R/P)+2(R/H)
Code Book
To facilitate coding, a standardized sheet was used. On these coding sheets we classify the data by simply placing check marks or slashes in predetermined spaces. We have done all the coding work by using VCR on pre-recorded video films of PTV Urdu dramas telecasted during the months of January to march 2004. With the help of stop watch we record all the durations of violent scenes on our code sheet. Computer was used for tabulating, and data analysis by statistical package for social sciences (SPSS).
DATA ANALYSIS
Before providing final test of the study's hypothesis by signorielli model (1980), it is customary to present descriptive statistics in term of univariate frequency distribution on each of the major variable involved in this study.
Table-1
Univariate frequency distribution of types and duration of violence portrayed by ptv Urdu dramas during the, months of January 2004
WEEK |
violence scenes |
Verbal Violence |
psychological Violence |
Total scenes |
Duration (minutes) |
Duration of Violence scenes |
Duration of violence |
1 ST |
18 |
8 |
*14 |
58 |
120 |
46.49 |
36.09 |
2 ND |
11 |
7 |
7 |
55 |
120 |
22.05 |
14.29 |
3 RD |
18 |
8 |
15 |
72 |
160 |
34.5 |
28.07 |
4 TH |
30 |
13 |
29 |
100 |
200 |
71.09 |
56.45 |
Total |
77 |
36 |
65 |
285 |
600=10 hrs |
174.13 |
134.9 |
% |
27.01 |
12.63 |
22.80 |
|
|
29.02 |
22.48 |
N=18 * scene contains more than one type of violence
This table 1 reveals that during the 4 th week of the month the ratio of psychological violence is significantly high 96.66 %. During the 2 nd week the portrayal of verbal and psychological violence remain equal i.e., 63.6% of total scenes. While PTV portrays 56.45% duration of violence out of total 71.09% duration of violence scenes during the 4 th week of the month.
Table-2-
Different types of violence portrayed by ptv Urdu dramas during the month of January 2004.
2. a
verbal violence |
1 st week |
2 nd week |
3 rd week |
4 th week |
Total |
% |
Exchange of harsh wording |
05 |
03 |
06 |
09 |
23 |
63.88 |
Exchange of word abuses |
0 |
0 |
00 |
0 |
00 |
00 |
Using loud voice |
03 |
04 |
02 |
04 |
13 |
36.11 |
Total |
08 |
07 |
08 |
1 3 |
36 |
|
2. b
Psychological violence |
1 st week |
2 nd week |
3 rd Week |
4 th week |
Total |
% |
Depressed |
08 |
02 |
08 |
15 |
33 |
50.76 |
Indirect Torture |
06 |
05 |
07 |
14 |
32 |
49.23 |
|
14 |
07 |
15 |
29 |
65 |
|
This table 2 indicates that in the verbal violence scenes the ratio of exchange of harsh wording against women remain high. While during the psychological violence scenes the ratio of depressed situation of victim is partially greater than ratio of indirect torture i.e., 50.76 Vs 49.23
Table-3-
Univariate frequency distribution of types and duration of violence portrayed by ptv urdu dramas during the month of February 2004.
WEEK |
Total Scenes |
Violence Scenes |
Verbal Violence |
Physical Violence |
Psychological violence |
Symbolic Violence
|
Total Duration (minutes) |
Duration of Violence scene
|
Duration Of violence
|
1 st |
100 |
32 |
17 |
1 |
87.5 |
3 |
200 |
56.61 |
50.8 |
2 nd |
90 |
38 |
27 |
0 |
94.75 |
1 |
200 |
85.41 |
65.25 |
3 rd |
89 |
37 |
25 |
0 |
91.89 |
2 |
200 |
84.5 |
80.13 |
4 th |
88 |
42 |
18 |
0 |
88.09 |
2 |
200 |
90.15 |
78.56 |
Total |
367 |
149 |
87 |
1 |
90.30 |
8 |
800 = 13.33 hours |
316.67 |
274.74 |
% |
|
40.59 |
23.70 |
0.27 |
36.78 |
2.17 |
|
39.58 |
34.34 |
N=20 * scenes contains more than one type of violence
This table 3 shows that during the months of February PTV presented 40.59% violence scenes on which the percentage of psychological violence remain significantly high.36.78%.
And in the 2 nd week PTV portrayed psychological violence 94.73 % which is significantly high from rest of the week. Table also reveals that in this month PTV telecasted violence of 275mts duration. And during the 4 th week 42 violence scenes of 90.15mts duration were emerged in which PTV presented 78.56 mts. duration of violence. While during the 3 rd week PTV telecasted 80.13mts duration of violence acts in 37 violence scenes of 84.5mts duration.
Table-4-
Different types of violence portrayed by ptv Urdu dramas during the month of February 2004.
4.a
PHYSICALVIOLENCE |
1 st week |
2 nd week |
3 rd week |
4 th week |
Total |
% |
Beating With / Hands / Legs / Sticks/Weapons Slapping /Any Other |
01 |
00 |
00 |
0 |
01 |
100 |
Pulling / Pushing And Acid Burning |
00 |
00 |
00 |
00 |
00 |
00 |
Total |
01 |
00 |
00 |
00 |
01 |
|
4.b
Exchange Of Harsh Wording |
14 |
22 |
24 |
16 |
76 |
87.35 |
Exchange of word abuses |
00 |
00 |
0 |
00 |
00 |
00 |
Using loud voice |
03 |
05 |
01 |
02 |
11 |
12.67 |
Total |
17 |
27 |
25 |
18 |
87 |
4.c
PSYCHOLOGICAL VIOLENCE |
1 st week |
2 nd week |
3 rd week |
4 the week |
Total |
% |
Depressed |
16 |
19 |
25 |
21 |
81 |
60. |
Indirect Torture |
12 |
17 |
09 |
16 |
54 |
40. |
Total |
28 |
36 |
34 |
37 |
135 |
|
4.d
SYMBOLIC VIOLENCE |
1 st week |
2 nd week |
3 rd week |
4 th week |
Total |
% |
Gazing |
01 |
01 |
00 |
01 |
03 |
37.5 |
Facial expression |
02 |
00 |
02 |
0 |
04 |
50. |
Expression of beating but not actually beating |
00 |
00 |
00 |
01 |
01 |
12.5 |
Total |
03 |
01 |
02 |
02 |
08 |
|
This table 4 a, b, c & d indicate that during the month of February mostly psychological violence portrayed by PTV and during the psychological violence scenes mostly victims are shown in depression 81 (60) while during the verbal scene mostly exchange of harsh wording 76 (87.35) is portrayed. The ratio of exchange of harsh wording88.8% and depression 56.7% remain high during the 4 th week.
Table-5-
Univariate frequency distribution of types and duration of violence portrayed by ptv urdu dramas during the months of march 2004.
WEEK |
Total Scenes |
Violence scenes |
Verbal Violence |
Physical Violence |
Psychological violence |
Symbolic Violence |
Duration minutes |
Duration violence scene |
Duration of violence |
1 ST |
79 |
34 |
14 |
0 |
91.17 |
1 |
200 |
99.02 |
83.02 |
2 ND |
94 |
29 |
11 |
1 |
82.75 |
0 |
200 |
69.18 |
60.04 |
3 RD |
69 |
26 |
15 |
0 |
80.76 |
1 |
160 |
67.06 |
55.37 |
4 TH |
38 |
17 |
11 |
0 |
100 |
0 |
80 |
38.38 |
35.09 |
Total |
280 |
106 |
51 |
1 |
93 |
2 |
640=10.66 hours |
273.64 |
233.53 |
% |
|
37.85 |
18.21 |
0.35 |
33.21 |
0.71 |
|
42.75 |
36.48 |
N=16 *scenes contains more than one type of violence missing=04
This table 5 reveals that during the 4 th week of the month PTV portrayed 100% psychologically violence then from the rest of the week. The same type remains significantly high (33.21%) then the other types of violence during this month. PTV presented violence scenes in greater ratio during the 1 st (43.03) and the 4 th (40.7) week of the month then the 2 nd and 3 rd weeks. Table also reveals that 42.75% duration of violence scenes are presented during this month and with in this duration PTV portrays 36.48 % violence to its viewers
Table-6-
Different types of violence portrayed by PTV Urdu dramas during the month of March 2004.
6. a
VERBAL VIOLENCE |
1 st week |
2 nd week |
3 rd week |
4 th week |
Total |
% |
Exchange Of Harsh Wording |
12 |
09 |
13 |
10 |
44 |
86.27 |
Exchange of word abuses |
0 |
0 |
0 |
0 |
0 |
0 |
Using loud voice |
02 |
02 |
02 |
01 |
07 |
13.72 |
Total |
14 |
11 |
15 |
11 |
51 |
|
6.b
PHYSICALVIOLENCE |
1 st week |
2 nd week |
3 rd week |
4 th week |
Total |
% |
Beating With/Hands/Slapping Legs/Sticks/Weapons/Any other |
0 |
0 |
0 |
0 |
00 |
00 |
Pulling / Pushing And Acid burning |
0 |
01 |
0 |
0 |
01 |
100 |
Total |
0 |
01 |
0 |
0 |
01 |
|
6. c
PSYCHOLOGICAL VIOLENCE |
1 st week |
2 nd week |
3 rd week |
4 th week |
Total |
% |
Depressed |
19 |
13 |
12 |
52.94 |
53 |
56.98 |
Indirect Torture |
12 |
11 |
09 |
08 |
40 |
43.01 |
Total |
31 |
24 |
21 |
17 |
93 |
|
6.d
SYMBOLIC VIOLENCE |
1 st week |
2 nd week |
3 rd week |
4 th week |
Total |
% |
Gazing |
01 |
0 |
0 |
0 |
01 |
50 |
Facial expression |
0 |
0 |
01 |
0 |
01 |
50 |
Expression of beating but not actually beating |
0 |
0 |
0 |
0 |
0 |
|
Total |
01 |
0 |
01 |
0 |
02 |
|
These tables 6 a, b, c & d show that during the month of March PTV portrayed four types of violence against women i.e., verbal, physical, psychological and symbolic violence. But the ratio of psychological violence remain high 33.21% and the ratio of physical violence remain low 0.35% in the verbal violence scenes violent character mostly involved in greater ratio in the act of exchange of harsh wording 86.27% than using loud voice 13.72% with the victims. No incident of beating with or without weapon is portrayed but one case of acid during is presented in physical violence scenes. During this month and the ratio of symbolic violence remain low 0.71.
Table-7-
Univariate frequency distribution of types and duration of violence portrayed by
PTV Urdu dramas during the, 1 st quarter of 2004
Months |
Total Scenes |
Violence Scenes |
Verbal
|
Physical
|
Psycho- logical |
Symbolic
|
Duration (minutes) |
Duration of Violence scene |
Duration of violence |
January |
285 |
77 |
36 |
0 |
65 |
0 |
600 = 10 hours |
174.13 |
134.9 |
February |
367 |
149 |
87 |
01 |
135 |
08 |
800 = 13.33 |
316.67 |
274.74 |
March |
280 |
106 |
51 |
01 |
93 |
02 |
640 = 10.66 |
273.64 |
233.53 |
TOTAL |
932 |
332 |
174 |
02 |
293 |
10 |
2040 |
764.44 |
643.17 |
% |
|
35.62 |
18.66 |
0.21 |
31.43 |
1.07 |
|
37.47 |
31.52 |
N=60 *scenes contains more than one type of violence Missing=6
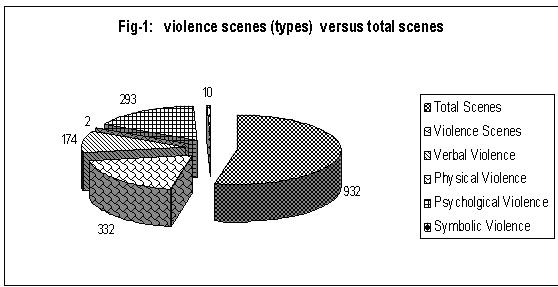
This table-7 and figure 1 reveal that the ratio of psychological violence (90.60) scenes remains high during the month of February while the ratio of same type remains significantly high 31.43 % during this quarter. Fig-1, show that during the 1 st quarter of 2004 PTV telecasted 332 number of violence scenes of 764.44mts duration in which it portrayed 643.17mts duration of violence to its viewers during the prime time transmission hours. Table 7 also reveals that during the month of February PTV portrays maximum violence scenes149 and the ratio of violence remains high in these scenes i.e.86.75%.
Table-8
Different types of violence portrayed by PTV Urdu dramas during the 1 st quarter of 2004
8.a
VERBAL VIOLENCE |
January |
February |
March |
Total |
% |
Exchange Of Harsh Wording |
23 |
76 |
44 |
143 |
82.18 |
Exchange of word abuses |
00 |
00 |
00 |
00 |
00 |
Using loud voice |
13 |
11 |
07 |
31 |
17.81 |
Total |
36 |
87 |
51 |
174 |
|
8.b
PHYSICAL VIOLENCE |
January |
February |
March |
Total |
% |
Beating with/Hands/slapping Legs/Sticks/Weapons |
00 |
01 |
00 |
01 |
50. |
Pulling/Pushing and Acid burning |
00 |
00 |
01 |
01 |
50. |
Total |
00 |
01 |
01 |
02 |
|
8.c
PSYCHOLOGICAL VIOLENCE |
January |
February |
March |
Total |
% |
Depressed |
33 |
81 |
53 |
167 |
56.99 |
Indirect Torture |
32 |
54 |
40 |
126 |
43.003 |
Total |
65 |
135 |
179 |
293 |
|
8.d
SYMBOLIC VIOLENCE |
January |
February |
March |
Total |
% |
Gazing |
00 |
04 |
01 |
05 |
50 |
Facial expression |
00 |
04 |
01 |
05 |
50 |
Expression of beating but not actually beating |
00 |
00 |
00 |
00 |
|
Total |
00 |
08 |
02 |
10 |
|
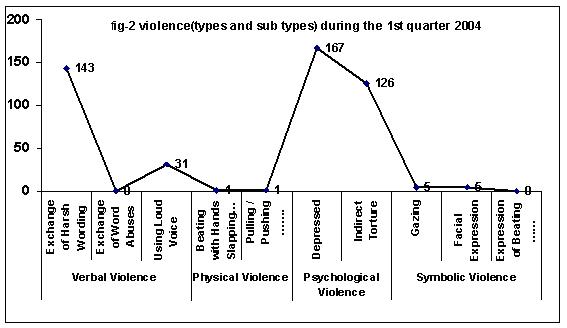
These tables 8 a, b, c & d and Figure 2 shows that during 1 st quarter of 2004 PTV portrays all four types of violence against women in its Urdu dramas. During this period the ratio of psychological violence remains high (88.25%) and the ratio of physical violence remains significantly low (0.60%).The emergence of psychological violence remains high during the month of March while the ratio of physical and symbolic violence portrayed in high ratio during the month of February .But no physical and symbolic violence was portrayed during the month of January. In the verbal violence scenes 82.18% exchange of harsh wording while in psychological violence scenes 56.99% Depression was portrayed.
FINDINGS
Univariate Frequency Distribution
Data analysis reveals that during the 1 st quarter of 2004 PTV telecasted 332 number of violence scenes of 764.44mts duration in which it portrayed 643.17mts duration of violence to its viewers during the prime time transmission hours. Findings indicated that during this quarter PTV portrayed all four types of violence i.e.,
Verbal/physical/psychological and symbolic violence against women but the ratio of psychological violence remain higher 31.43% than the verbal 18.66% violence, while the ratio of physical and symbolic violence was portrayed in low ratio 0.21% and 1.07% respectively. In the verbal violence scenes the portrayal of harsh wording amounting to 82.18% was appeared. One incident of killing with the weapon and one case of acid burning were also presented in the physical violence scenes. While50% facial expression was used to show symbolic violence against women. In this quarter, during the month of February PTV portrayed 149 violence scenes of 316.67mts duration in which it presented 274.74mts duration of violence including 90.60% of psychological violence and this was the hypothesized direction. This ratio of violence remain significantly high from rest of the months.
TESTING OF HYPOTHESIS BY SIGNORIELLI MODEL (1980)
a) Programs score on prevalence of violence
Data analysis shows that in the overall quarter, during prime time transmission PTV portrayed violence amounting to 55.22% of all program hours. This ratio remains high in the month of February i.e.63.73% and remains less in the January i.e.42.95%.
Table-9-
Week-wise program score (ps) on prevalence of violence in PTV Urdu dramas during the 1 st quarter of 2004
PS=%P+2(R/P) +2(R/H)
Weeks |
January |
February |
March |
1 ST |
49.62% |
51.8% |
64.2% |
2 ND |
31.4 |
65.58 |
47.96 |
3 RD |
39.07 |
63.96 |
59.4 |
4 TH |
48.56 |
73.24 |
70.44 |
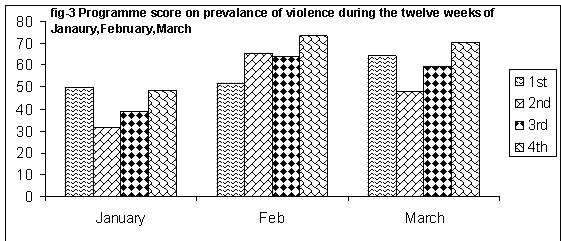
Table 9 and Figure 3 shows Week-Wise Program Score (Ps) on Prevalence of Violence. During the 1 st week of January 49.62 present of all progrem hours contains more violence.
Similarly during the 4 th week of February and March Program Score (Ps) on Prevalence of Violence remain higher than the rest of the weeks in the 1 st Quarter of 20004.
Table-10-
Week-wise prevalence of different types of violence in PTV
Urdu dramas during the 1 st quarter of 2004
PS=%P+2(R/P) +2(R/H)
WEEKS |
TYPES |
JANUARY |
FEBRUARY |
MARCH |
1 st |
Verbal Violence |
22.03 % |
27.54% |
27.65% |
Physical Violence |
00 |
1.62 |
00 |
|
Psychological Violence |
31.61 |
45.36 |
61.27 |
|
Symbolic Violence |
00 |
4.86 |
1.95 |
|
2 ND |
Verbal Violence |
19.96 |
46.76 |
18.5 |
Physical Violence |
00 |
00 |
1.66 |
|
Psychological Violence |
19.96 |
62.34 |
40.39 |
|
Symbolic Violence |
00 |
1.6 |
00 |
|
3 RD |
Verbal Violence |
17.31 |
43.6 |
34.65 |
Physical Violence |
00 |
00 |
00 |
|
Psychological Violence |
32.45 |
59.3 |
48.53 |
|
Symbolic Violence |
00 |
3.46 |
2.28 |
|
4 TH |
Verbal Violence |
21.06 |
31.61 |
46.04 |
Physical Violence |
00 |
00 |
00 |
|
Psychological Violence |
46.98 |
65.02 |
71.17 |
|
Symbolic Violence |
00 |
3.49 |
00 |
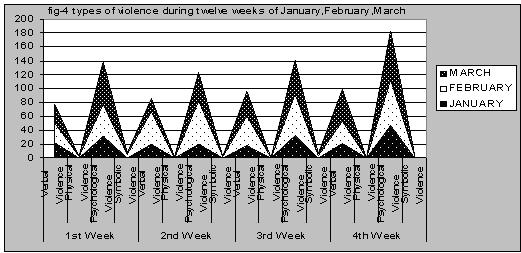
Table 10 and Figure 4 indicate the difference in portrayal ratio of verbal, physical, psychological and symbolic violence in all twelve weeks of January, February and March. As was hypnotized that during the sampled months psychological violence portrayal is higher ratio than all other types of violence. Interestingly no symbolic violence was coded during the 1 st week of January and March. Table also indicates that the ratio of verbal violence remain high in the 2 nd week of February and 4th week of March in hypnotized direction
CONCLUSION
After applying the Signorielli Model (1980) to test the hypothesis and data analysis, the findings reveals that in the 1 st quarter of 2004 PTV portrayed violence against women in 55.22% of all program hours during the prime time telecasted dramas serials i.e. Porey chand ki raat,Abla Pah,,Adhi Gawahi, ,Atish and Khawab Kheyal. Specifically in terms of verbal/physical/psychological and symbolic violence against women as portrayed in PTV Urdu dramas it is revealed by the findings that the psychological and verbal violence were portrayed in greater ratio than the symbolic and physical violence. The finding strongly supports the studies hypothesis, i.e. higher the prevalence of violence higher will be the prevalence of verbal and psychological violence. The portrayal of verbal and psychological violence in high proportion indicated the presence of conflict ideas in the stories .On the other side less portrayal of physical and symbolic violence shows the discouraging tends of using negative measure for resolution.
REFERENCES
Adoni, H.And Mane S.(1984).Media And The Social Constriction Of Reality: Towards An Integration Of Theory And Research. Communication Research 11,323_340.
Anne Nelson,(1994) Colour of Violence, Index on Censorship, Catherine Sieman's report is published in Letters;Vfor viewing in the September/October 1994 edition of index.
Bogart,L, (1958) The age of Television. New York . Ungar
Defleur/Dennis 1998, Understanding Mass Communication: A Liberal Arts Perspective P46 Ed . Houghton Mifflin A company New York
French, M (1992) The War Against Women. New York : Summit .
Gerbner G (1970), Cultural indicators: the case of violence in television drama. The Annals of the American Academy of Political and Social Science 388:69-81.
Gerbner, G.et al.(1969) Dimension of Violence in Television Drama, in Baker and Ball(eds)Violence and the Media.pp.313-327,Washington D.C.U.S/Government.
Gerbner,G.(1969)Toward cultural Indicators': The analysis of Mass mediated message systems.AV Communication Review, 19(2), 137-148.
Gerbner,G.(1970) cultural Indicators': The case of violence in television drama. The Annals of the American Academy of Political and Social Science,388,69-81.
Gerbner,G.(1972a). Communication and social environment. Scientific Americans ,227(3),152-160.
Gerbner, G., Gross, L.,Signoriell, N., Morgan, M., and Jackson . Beeck, M. (1979). The demonstration of power. Violence profile no 10 . Journal of Communication,29(3),177-196.
Gerbner, G. Gross, Signorielli, N and Morgan,M.(1980) Aging with Television;Images on Television Drama and Conception of Sociality Journal of Communication 30;37-47
George Gerbner (1992) Violence and Terror in and by the Media, in Mure Ra boy and Bernard Dogenais (eds), Media Crsis and Democracy: Mass Communication and the Disruption of the Social Order, Sage, U K.
Gerbner, G. Gross, Signorielli, N and Morgan, M (1980) The main streaming of America ; Violence Profile No-11J ournal of Communication,30,10-29
Morgan,M(1983). Symbolic Victimization and real-world fear. Human Communication Research 9(2),146-157.
Pakistan Statistical Year Book 2003.P241 Federal Bureau Of Statistics Division Government Of Pakistan March 2003}
Raney,R. and Jennings Bryant (2002) Moral Judgment and crime Drama; An Integrated theory of Enjoyment Journal of Communication.
Williams,R. 1977 Television, Technology And Cultural Form Fontana .
ABOUT THE AUTHORS
• Robina Roshan is Assistant Professor, Mass Communication department, Gomal University , Dera Ismail Khan, (NWFP), Pakistan .
• Dr. Muhammad Aslam Parvez is Assistant Professor, Mass Communication department, Gomal University , Dera Ismail Khan, (NWFP), Pakistan .
• Dr Syed Abdul Siraj is the Chairman, Department of Mass Communication, Allama Iqbal Open University, Islamabad , Pakistan .
Copyright © 2006 Global Media Journal. All rights reserved.