|
|
|


Home | Current Issue | Editions | Archives | Contact Us
Correlation Between Media's Political Content and Voting Behavior:
A case Study of 2008 elections in Pakistan
Mr. Noman Yaser
Dr. Muhammad Nawaz Mahsud
Dr. Sajjad Ahmad Paracha
Abstract
This study explores the correlation ship between audience members' consumption of media political content and their vote casting behavior during 2008 general elections. Data has been collected using face to face interviews technique from 400 respondents (200 male and 200 female registered voters) from urban and sub-urban Lahore (100 males and 100 females each from each area). The findings reveal that voters spent more time on consuming television political contents followed by reading newspapers for the same purpose. However, it is indicated by the results that the overall respondents significantly got political information from television followed by interpersonal channels than newspapers and radio. The overall as well males, the people of urban location, and those having high education very often while females and respondents with low education somewhat significantly use television for acquiring political information as compared to their cross categories respectively. The findings further indicate that overall respondents did not depend much on community leaders for acquiring political information and taking their voting decisions. It is also observed that television is perceived as the most preferred medium by the respondents for acquiring political information and taking vote casting decision during elections 2008 followed by interpersonal channels respectively. The respondents had far less dependency on the newspapers for this purpose and overwhelming majority did not listen to radio for acquiring political information.
Study's Background
There is no concept of modern democracy without free and fair elections. Similarly, there is no concept of free and fair elections in the absence of a free mass media. So, democracy, elections and media are indispensable for each other. In Pakistan since the 62 years of its establishment, elections have been conducted with irregular intervals. The brief history of elections in Pakistan gives an insight to the democratic process in Pakistan . The First period of electoral politics in Pakistan 's history from 1947 to 68 can be divided into two phases: i) parliamentary phase (1947-58) and ii) presidential phase (1962 to 1969). In the first phase (1947-58), no direct elections were held in Pakistan at the national level. However, four direct provincial elections were held; in Punjab and NWFP in 1951, in Sind in 1953 and in East Bengal in 1954. Provincial elections were held occasionally. The first ever direct elections for the provincial assembly of Punjab were held in March 1951 for 197 seats. Provincial Elections for the North West Frontier Provincial assembly were held on 8 th of December, 1951. The elections for the Sind Provincial assembly were held in May, 1953 while Elections for the East Pakistan Legislative Assembly were held in April, 1954. However, elections in this phase lacked legitimacy in an operational sense because of procedural malpractices.
Elections in the second presidential phase from 1962 to 1969 suffered from a gap of legitimacy in a structural sense. Indirect elections for president and the national assembly in 1962 and 1965 missed out on general acceptance by the people. Major issues relating to elections in Pakistan in this period revolved around adult franchise and direct elections for assemblies within a parliamentary framework (Waseem, 2006). During this phase, through the introduction of presidential system, Field Marshal Ayyub Khan served as the president of Pakistan .. He was forced by circumstances to resign on 25 th March 1969 , handing over power to Gen Muhammad Yahya Khan, then Commander-in-Chief of Pakistan Army. Zulfikar Ali Bhutto founded Pakistan People's Party ( PPP ) in November 1967 and remained successful to raise it to the status of national party (Becker & Raveloson, 2008) and Kennedy (1987). Syyed (1992) opines that Mr. Bhutto did not set the tradition of conducting elections within the party. He, instead, made nominations of persons as the members of the central executive committees and important positions at different levels. The second period of electoral politics in Pakistan history started with the 1970 elections. Pakistanis got an opportunity to cast their votes on adult franchise basis in the first general elections held on December 07, 1970 . As a result of these elections, the first national assembly comprising 313 members ( East Pakistan having 169 seats while West Pakistan having 144 seats) came into existence (Shafqat, 1998).
Mushfiq (2009) states that political analysts have declared the 1970 elections as the only free and fair with a stunning setback for the older political parties as Pakistan People's Party led by Zulfiqar Ali Bhutto in the West Pakistan and Awami League led by Mujeeb-ur-Rehman in the East Pakistan gained majority seats. Z. A. Bhutto came to power as the first civilian martial law administrator on 20 th December, 1971 . The proclamation to this effect was issued by General Yahya Khan, giving Bhutto the title of the president of Pakistan , CMLA and Commander-in-Chief of the armed forces of Pakistan . The tragedy of East Pakistan became of subsequent importance as democracy assumed power in West Pakistan , now known simply as Pakistan (Ahmad, 2002). the PPP government formulated 1973 constitution which was adopted by all mainstream political parties of Pakistan (Becker & Raveloson, 2008). After completing his mandatory tenure Mr. Bhutto announced elections date for provincial and national assemblies to be held on March 7 and 10, 1977, respectively. The 'PPP' won 136 seats while it had already got 19 NA seats unopposed. The 'PNA' leveled allegations of massive vote-rigging and boycotted the provincial elections (cited at: http://www.pakistan.gov.pk ). Countrywide protest by Opposition finally led to a political turmoil and imposition of Martial Law by the then Army Chief, General Muhammad Zia-ul-Haq on 5th July, 1977 .
The long term regime of president Zia (1977-85) brought fundamental changes in the electoral politics of Pakistan . The 1985 elections were held on non- party basis under the aegis of Zia. At a result non-party characters of these elections brought in multiple candidates in each constituency, who divided votes among themselves, and thus brought down the winning majorities of the victorious candidates (Waseem, 2006). Before the general elections of 1988 the Supreme Court gave its verdict in favor of party-based elections. During these elections, only the restoration of democracy was the real issue which supported Benazir's PPP to win elections. Pakistan Peoples Party under the leadership of Ms. Benazir Bhutto formed the government which was toppled by the then president Ghulam Ishaq Khan on August 16, 1990 on corruption charges. Fifth General elections were held for the National and Provincial Assemblies on October 24 and 27, 1990 respectively (cited at: http:// www.elections.com.pk ). Mr. Nawaz Sharif acceded to power for the first time as a Prime Minister.
The Assembly, however, was dissolved by the then President, Ghulam Ishaq Khan, under Article 58(2)(b) on 18 April 1993 (cited at: http://www.na.gov.pk ). Supreme Court of Pakistan dismissed the presidential orders of dissolving the assembly, but later soon assembly was dissolved in July, 1993 and caretaker set-up was assigned the responsibilities to hold the general elections. The 6 th general elections were held in 1993 providing a second opportunity to Benazir Bhutto to become Prime Minister for the second time. This Assembly was dissolved by the then President Farooq Ahmad Khan Laghari on November 5, 1996 (cited at: http://www.na.gov.pk ) again on corruption charges. On 3 February, 1997 general election were held and the Muslim League headed by Mr. Nawaz Sharif succeeded in getting almost 66% representation in the lower house showing such a significant difference for the first time between the seats won by PPP and PML ( Gilani, (2008). In 12 0ctober, 1999, General Musharraf, dismissed Nawaz Sharif government in an army Coup action and become the chief executive. Later, General Musharraf announced to conduct general Elections in 2002. The election results revealed that the major share of seats (77) was got by Pakistan Muslim League (Quaid-i-Azam), which supported President Musharraf's government, but could not get majority to form the government exclusively. The runner up was Pakistan People's Party securing 63 seats while the alliance of six political parties-MMA- got forty five seats. Pakistan Muslim League (Nawaz) could won only fourteen seats. Musharraf after through a referendum conducted in April 2002 got the title of President. He made the constitutional arrangements to remain Former Prime Ministers Ms. Benazir Bhutto and Mr Nawaz Sharif out of the electoral process along with different party candidates of both of the parties (Gilani, (2008).
History of elections in Pakistan is very troubling and disappointing. The sixty years history of Pakistan has witnessed six general elections. The results of one election resulted in the disintegration of Pakistan . Three of the elected assemblies failed to complete their stipulated tenure as the governments were toppled on different charges by the hidden forces whom democracy did not suit. The government formulated as a result of 2002 elections although completed its tenure, it however, did nothing for the betterment of the public and instead threw it into despair (Abbas, 2008).
General Elections 2008
General elections 2008 were different in nature from all the elections held earlier. These elections were being held in a very tense situation. There have been a series of complicated and severe problems being faced by the nation during that phase. One of the major problems has been in the form of terrorism which has shattered the entire nation in almost every field of life. The public facing the shortage of basic commodities of life, high level ratio of poverty and unemployment that created very overall very expensive and psychological tense situation. During this phase, there have been so many up and dawns in terms of curbs on the mass media, judicial crisis and general perception of pre poll and poll day rigging. The main stream political parties especially PPP and PML (N) were speaking explicitly about the corruption and rigging. They were providing facts and figures to the media about rigging. These elections were very crucial with regard to the future of Pakistan (Rashid ( 2007 ). But unfortunately, the situation was so adverse that different political parties were accusing election commission to favor specific political parties supported by the government. At the same time, there was a lot of mistrust on the care taker set up as it was partial and the local governments were still trying hard and using state resources to ensure the victory of the candidates supported by Musharraf regime.
On 3 November 2007 , President General Pervez Musharraf imposed a state of emergency in the country. The elections were postponed after the imposition of emergency and elections were announced to be held on February 15, 2008 (news.bbc.co.uk). The election campaign was in full swing when Benazir was assassinated in Rawalpindi on 27 Dec 2007 addressing a rally. This was a great set-back for the country. It seemed clear that elections would be postponed after this incidence. However, Musharraf after holding an emergency meeting with top officials announced that they had yet to decide whether to post pone the elections or to hold them as per schedule ( guardian.co.uk ). The Pakistani Election Commission announced after a meeting in Islamabad that the election would take place on Feb18. Different suicide attacks took place to assassinate political leaders and terrorist incidents occurred during political processions and rallies weeks before the elections. One of such incidents occurred in Charsadda which targeted the political rally of Awami National Party killing 27 innocents and injuring 37 . Another event of suicide bombing in Parachinar killed 37 innocent people. Similarly, a polling station was targeted in Bajaur to create fear among the voters (en.wikipedia.org).
So, General elections were held in Pakistan on 18 February 2008 . The Elections were held to elect members of the National Assembly of Pakistan , the lower house of the Majlis-e-Shoora , the nation's parliament. The people of Pakistan exercised their right to vote and elected the representatives according to their choice. Although, there was news of rigging on some polling stations and in certain constituencies, yet the conduct of elections may be declared comparatively transparent as compared to the general elections 2002. A large number of prominent politicians, ex- Members of National and Provincial assemblies including Prime Minister and ministers in the previous government lost the election. According to the information on (www.angus-reid.com ), Pakistan People's Party (PPP) won the maximum seats followed by Pakistan Muslim League (N) in the election. The Pakistan Muslim League (Q) was second in the popular vote. A coalition government was formed by PPP and PML (N) electing Yousaf Raza Gillani as the new Prime Minister of Pakistan . After the elections, President Musharraf declared the elections process to be free and fair admitting the results and showing his consent and offer to work with the new set-up. Finally, he had to resign as Army Chief on November 28, 2007 and as president of Islamic Republic of Pakistan on August 18, 2008 Consequently, Mr. Asif Ali Zardari took over as the president.
Elections 2008 are very important and have a great significance for the people of Pakistan . These Elections at that time were thought to be a ray of hope for the Pakistanis as they were getting an opportunity to decide their destiny according to their desires after a long period of time since 1998. The significance of these Elections can be ascertained by the comments of Fazal (2008) who stated that we are entering a prolonged period of transition from military to civilian rule with the general elections 2008.
Literature Review
Election and media both are considered indispensable to each other. Numerous studies in abroad have been conducted on the topic under consideration (Berelson et al.; 1954; Lazarsfeld et al,1948; Blumler & McLeod,1974; Gitlin, 1978; Neumann, 1984; and Iyenger & Simon, 2000 ). After the 1970s, an increasing number of researchers became interested in political communication, and the number of studies mushroomed. Studies have begun to show connections between the various components of the communication process and effects on audiences (Bryant & Thompson, 2002). Studies have focused primarily on two type of media content related to political communication: political advertising and news stories (p.309). According to Waseem (2006) Several scholars from Pakistan have taken up research on elections and electoral politics in Pakistan . The available academic research on elections is generally related to the performance of political parties and alliances, the nature of the campaign and other macro level electoral currents. Few systematic studies of voting trends at micro-level are available Therefore, it is a need to briefly describe the role of media in our country in creating political awareness, formulating public opinion and shaping political; behavior of the voters of Pakistanis.
Political communication has acquired significant importance in the modern democracies. It has grown as an important subject of communication and an important arena of communication research and has produced a lot of literature. According to Blumler and Gurevitch (1995) political communication is based on triadic relationship among political actors, the mass media and audience members, each of whom plays its role in message production, reception and interpretation. The beginnings of communication study by Lippmann (1922), and Lazarsfeld et al., (1944) and other researchers levied deep impact on the field of political communication. Researchers in this field focused mainly on mass mediated political communication effects despite the findings that the effects were supported and strengthened by interpersonal channels. Studies on Political communication, from its beginning, focus on dependent variables like voting choice at individual level while now the effects on societal level are of much concern of political communication. McLeod et al., (2002) opine on this level of effects that most political action and power relationships operate at the societal or other systemic levels, whereas the bulk of empirical theory and research concentrate on the behavior of the individual citizen.
A number of studies have explored the power of media messages to produce or change the political opinions of audience members. The voting studies of Lazarsfeld and his colleagues (1948) found only a limited amount of influence from mass media on political opinions of audiences. Later studies explored that political media messages had much greater effects than previously found (Blumler & McLeod, 1974; Ranny, 1983; McLeod & Mcdonald, 1985; & Simon, 2000). Different perspectives and models of persuasion, such as Petty & Cacippo (1986) and Fishbein and Ajzen (1975) have been used by many researchers to study the effects of political communication. Many research studies (Fazio & Williams, 1986; Granberg & Brown, 1989; Krosnick, 1988; & O'keefe, 1985l; have used the persuasion models to understand the campaign effects. According to Mcleod et. al, (1994) cognitive effects for mediated political messages have been studied through the use of agenda setting research, priming research, knowledge gain and framing in the recent decades.
McCombs & Shaw's (1972) agenda setting hypothesis states that the news media determines prominent issues through their expanded coverage of particular issues, and these issues are considered important by the public. Research supports the notion that the issues that receive the most coverage are the very issues that the public perceives as important (Funkhouser, 1973; MacKuen,l 1981; McCombs, 1977; Tipton, Haney, & Basehart, 1975; McLeod, & Byrnes, 1974; Iyengar & Kinder, 1987). Priming has been shown to affect political opinions and voting decisions. Iyengar and Kinder (1987) found that issues that received prominent media coverage primed audiences in their evaluation of presidential performance. The role of mass media in political communication and political behavior has been discussed by different researchers in different perspectives. The mass media has become so pervasive in the lives of the people that these have become a major source of information for them. According to Nimmo and Combs (1983) in the twentieth century media have emerged to be a major source of political information for most of the people most of the time. Different studies (Conovor & Feldman, 1989; Gunter, 1987; McLeod et al., 1979) have found that while the audiences may or may not be persuaded by mediated political communication, they often learn from such messages. According to these studies, news reports about campaign issues and candidates, political debates, and conventions have all been shown to be responsible for various amounts of knowledge gain among audiences.
One of the primary functions of the mass media is that they provide the information to the public which is beyond their observation or direct experience. Cook (1998) is of the view that arguably the mass media serve as the main link between governments, political parties, candidates etc., and voters, as the opportunities for direct communication between citizens and their representatives are extremely limited both with regard to scale of audience reached and issues covered. However, the media are not just channels conveying the messages politicians want them to communicate to voters. They are also active participants in the creation of political messages. According to the findings of some studies (Dearing and Rogers 1996; McCombs et al. 1997), even though most of the time the media are not the immediate originators of these messages, they have a significant impact on what is communicated in the public sphere, and what is omitted, thereby setting the agenda of the political debate. The findings of different studies (Della et al., 2006 and Gerber et al., 2007) explore that media can in fact affect voting behavior. Significant media effects were observed through a survey based study by Colton and McFaul (2003) on the outcomes of Russian elections in 1999 and 2000.
Gerstle et al. , (1991) state, the meanings of politics are communicated to us through journalists in the form of narrative frameworks and to be told as news stories. Politicians and political parties employ different campaign channels to get their messages across to the voters. A study conducted by Scherer (1995) based on comparison of the relevance of different campaign channels for voters in twelve EC member states during the 1989 European election campaign reveal that different media have specific relevance in different countries like posters in Germany, radio in Greece, newspaper ads in Denmark, and party brochures in Great Britain. Different channels of mass communication including television, radio, news papers and internet play a significant role during elections and in general conduct of politics. Many scholars suppose that media do cultivate low political self-efficacy and political cynicism (Cappella & Jamieson, 1996). Other scholars failed to find a clear relationship between political media content and political support (Newhagen, 1994; Moy & Scheufele, 2000). Some scholars reveal that the relation between media use and political support is suspected as both of these concepts are correlated with social demographic variables, and with political knowledge and political ideology (Moy & Scheufele, 2000).
Different studies have revealed the role of mass media in the attitude and behavioral change while others have focused on the role of mass media in the provision of political information only. Some state that it varies according to the nature of mass media channels, others are of the view that the effects may be different on the basis of difference in demographic characteristics. In this connection, a study on the relation between media use and political knowledge in the Netherlands led to the conclusion that a clear and positive relation exists between the frequency with which citizens consume political content from the mass media, and the amount of political knowledge they acquire from it (Hendriks, Vettehen, Hagemann, & Snippenburg, 2004). Similarly, according to Petty & Cacioppo (1986) political attitudes are based on information possessed or acquired by citizens, in combination with deeper felt beliefs and that the attitude and behavioral change occurred as a result of adopting central route to persuasion is normally long term. Pinkleton et al. (1998) asserts that active political media use, serves as a catalyst for political participation as it increases the involvement of the voters in the political process and a likelihood of the increased political participation.
The major literature in the field of media effects reveals that audience members perceive and interpret the information through a deep cognitive process and that direct and immediate effect of media messages on the audience is very rare. Livingstone (1996) and Zaller (1992) in this regard are of the view that audience members receive, decode and evaluate the political information on the basis of their existing cognitive schemata and beliefs. In the modern democracies, politicians and political parties heavily depend on media campaigns to get their messages across to the public. Media has become a part and parcel of political communication in general and during elections in particular. According to Worcester & Mortimore (2001) the electoral campaigning is not only related to development and implementation of media strategies at election time but has also become an essential part of political communication. It is a complex process of political socialization that ranges from interpersonal communication, the role played by political parties and the media as sources of political socialization. Other studies have found that while the audiences may or may not be persuaded by mediated political communication, they often learn from such messages. News reports about campaign issues and candidates, political debates, and conventions have all been shown to be responsible for various amounts of knowledge gain among audiences (Conovor & Feldman, 1989; Gunter, 1987; McLeod, Bybee, & Durall, 1979).
It is important to document the effects of mass media on the voting behavior of Pakistani voters in election 2008 because in these elections, mass media in general and electronic media in particular were supposed to enjoy a lot of independence and freedom. The freedom enjoyed by television channels during these elections was unprecedented in the history of Pakistan . But during 2008 elections, the private television channels had matured and they played supposedly very important role in the political education of the voters. So, studying the impact of media political contents on the voters' voting behavior in general elections 2008 is of great significance. The proposed study intends to document the effects of newspapers, radio, television and interpersonal channels on the voting behaviour of the audience members. Television, the press, radio and online media have very different and textual characteristics and varying kinds of political influence. Numerous surveys have revealed that a majority of people have television as their primary news source and that they regard television as the most trustworthy type of media (Craig, 2007). Television programmes have significant impact on values, time displacement, agenda setting and regulations. People use TV as major entertainment, information and knowledge providing medium (Narula, 2006). Print is the oldest and earliest mass medium but it still continues to be effective with its limitations both in developed and developing countries (p.152). Radio is assumed as not attribute to the same political influence as television and newspapers, yet it is the most pervasive type of mass media in the world, reaching people with low levels of television penetration and literacy. Radio, arguably more than any other mass medium, has a ubiquitous presence in everyday life: its aural basis means that it can accompany us while we do household chores, study, and drive in the car (p. 9). Similarly interpersonal channels play a very important role at almost all the levels of society . Studies have revealed that they play a very important role in providing information, amending attitudes and behaviours and may prove very effective at the time of decision making including voting decisions (p.146). In view of the above, this study seeks to investigate that w hat is the consumption pattern of voters' media political content? Whether the consumption and influence of media political content is differentiated on the basis of voters' age, gender, location, income and education? What is the relationship between voters' political content consumption patterns and voters' political participation?
Methodology
The study's universe is comprised of voters belonging to both urban and rural (suburban) areas of Lahore city. The units of analysis in the present study are registered male and female voters of Lahore , and the purpose was to explore their consumption habits of media political contents and its correlation with their voting behavior. Stratified sampling procedure has been used through which specification of the respondents demographic characteristics included: age (low, high), sex (male, female), location (urban, rural), income (low, high) and education (low, high). Stratified sample is based on studying a certain attribute in a population. For example, individuals are categorized as to whether or not they possess that attribute, which may be based on gender, ethnicity, educational level, and so on (Given, 2008). After the division of the respondents into the mentioned strata, application of purposive technique was applied to collect the data from the respondents, who were registered voters, the focus of the study. Given (2008) describes the sample size as the number of data sources that are actually selected from the total population. Basic principles of statistical sampling demonstrate that the accuracy of an estimate from a probability sample is strongly influenced by the size of the sample itself. Keeping in view the requirement of the study and for drawing meaningful inferences, face to face interviews from 400 respondents (200 male and 200 female registered voters) from urban and sub-urban Lahore (100 males and 100 females each from each area) were conducted.
The required data has been collected through the use of well designed questionnaire. To ensure a fair data collection, the services of professional team of freelance marketing research company from Lahore , were hired. The instrument (questionnaire) was translated into Urdu language keeping in view all types of respondents who hailed from different strata having different levels of education. The purpose was to avoid any misunderstanding or ambiguity to be faced by the respondents, and to protect data collection team from any complexity. Most of the questions were in closed-ended form while a few open-ended questions were asked to document the respondents' suggestion regarding media's role in election. A standardized questionnaire was prepared to develop uniformity in collecting data. Face to face interviews were conducted by the eight member professional team. The researcher himself gave briefing and arranged a training session to describe different dimensions and the requirements of the questionnaire. The researchers remained constantly in contact with the concerned supervisor of the team through telephone and e-mail and thus managed to co-ordinate the data collection team and to eradicate any confusion faced by the in the field. Similarly, the researcher was constantly supplied with data collection report and filled questionnaires on bi-weekly basis. To check the validity of the questionnaire, a pilot test was conducted on the homogenous population comprising twenty respondents. Certain changes were accommodated in the instrument based on the responses got through the pilot test. Finally, 400 respondents hailing from Urban and sub- urban Lahore were interviewed. The stratum was equally divided into 200 male and 200 female respondents (100 males and 100 females each from each area). Major questions are framed as under:
(a)What are the voters' consumption patterns of media political contents? (b) What are the differences between the voters' consumption patterns of political contents and their influence on their political participation? (c) What are the voters' consumption patterns of interpersonal political channels? (d) What is the influence of interpersonal communication on their political participation? (e) Whether the effects of consuming political contents are differentiated on the basis of voters' education, income level, gender and locality? (f) Whether they consume all media contents equally or it is differentiated on the basis of type of media?
Findings and Discussion
This study's results explore the people's consumption patterns of media political information and their political participation during General Elections 2008. The people in one way or the other use media for acquiring political information but with a degree of difference. Among the selected types of media, television is perceived as the most preferred medium which is used by the majority of overall respondents very often (45.7%) for obtaining political information (table 1.1). The analysis of the data shows difference among the respondents having different demographic characteristics. The males (51.5%) , the people of urban location (56%) , and those having high education (59.2%) very often while females (43%) and respondents with high education somewhat significantly use television for acquiring political information as compared to their cross categories respectively.
Table 1.1 Exposure to various sources for political information
Overall |
Age |
Gender |
Location |
Income |
Education |
||||||
a* |
b |
c |
d |
e |
f |
g |
h |
i |
j |
||
Television |
|||||||||||
Very often** |
45.7 ^ |
48.0 |
44.7 |
51.5 |
40.0 |
56.0 |
35.5 |
49.2 |
51.7 |
41.3 |
59.2 |
Somewhat |
37.3 |
38.0 |
37.0 |
31.5 |
43.0 |
33.0 |
41.5 |
28.2 |
36.0 |
39.3 |
32.1 |
Never |
17.0 |
14.0 |
18.3 |
17.0 |
17.0 |
11.0 |
23.0 |
22.6 |
12.3 |
20.4 |
08.7 |
Radio |
|||||||||||
Very often |
01.7 |
01.6 |
01.7 |
02.5 |
01.0 |
01.5 |
02.0 |
00.8 |
02.2 |
01.8 |
01.7 |
Somewhat |
09.8 |
17.4 |
06.5 |
11.0 |
08.5 |
13.0 |
06.5 |
09.6 |
15.8 |
06.3 |
18.3 |
Never |
88.5 |
81.0 |
91.8 |
86.5 |
90.5 |
85.5 |
91.5 |
89.6 |
82.0 |
91.9 |
80.0 |
Newspaper |
|||||||||||
Very often |
12.7 |
17.3 |
10.8 |
20.0 |
05.5 |
19.5 |
06.0 |
12.1 |
22.5 |
05.7 |
30.5 |
Somewhat |
26.5 |
32.2 |
24.0 |
36.5 |
16.5 |
28.5 |
24.5 |
34.7 |
34.8 |
23.8 |
33.0 |
Never |
60.8 |
50.5 |
65.2 |
43.5 |
78.0 |
52.0 |
69.5 |
53.2 |
42.6 |
70.5 |
36.5 |
Interpersonal channels |
|||||||||||
Very often |
19.6 |
24.0 |
17.9 |
26.5 |
13.0 |
21.0 |
18.5 |
17.7 |
28.1 |
15.5 |
31.0 |
Somewhat |
66.3 |
61.9 |
68.1 |
62.0 |
70.5 |
63.5 |
69.0 |
68.6 |
64.1 |
71.5 |
53.4 |
Never |
14.1 |
14.1 |
14.0 |
11.5 |
16.5 |
15.5 |
12.5 |
13.7 |
07.8 |
13.0 |
15.6 |
N=400 121 279 200 200 200 200 124 89 285 115
*: a Low age b High age c Male d Female e Urban f Rural g Low income
h High income i Low education j High education.
**: very often means very often and often, somewhat means somewhat and rarely, and never
refers to never and don't know.
Listening radio for political information showed that highly significant majority i.e., overall (88.5%) and the respondents of all types of demographic characteristics do not prefer to use radio for acquiring political information. The peoples' newspapers reading habits of political content revealed that majority i.e., overall (60.8%) and the respondents having different demographic characteristics significantly never consume content of newspapers published on politics, however, some of them are those who consume newspapers political content very often or somewhat but not at significant level. However high age respondents (65.2%) , females (78%) , rural respondents (69.5%) , those with low income (53.2%) and low education (70.5%) significantly never preferred to read newspapers for acquiring political information as compared to their cross categories respectively. The review of using interpersonal channels for the same purpose illustrates that a large number of overall (66.3%) respondents and those having different demographic characteristics significantly acquire information somewhat about politics using interpersonal channels, while little number of them is those who use the same channels for the same purpose very often. The males (26.5%), respondents with high income (28.1%) those with high education (31%) very often while respondents with low education (71.5%) somewhat use interpersonal channels significantly more as compared to their cross categories respectively (see table 1.1).
It has been observed that television is perceived as the most preferred medium by the respondents for acquiring political information during elections 2008 followed by interpersonal channels and newspapers respectively. The respondents had far less dependency on the newspapers for this purpose. Overwhelming majority of the respondents did not listen to radio for acquiring political information. The study's findings extended full support to the research hypotheses: it is more likely that the voters get political information more from television as compared to the news papers ' and it is more likely that voters acquire political information more from TV channels as compared to radio . Similarly, these findings extended partial support to the research hypotheses: it is more likely that type of mass media provide more political information as compared to interpersonal channels '. It was partially supported in term of television as providing more political information than interpersonal channels and partially rejected as interpersonal channels provide more political information as compared to other selected media. This situation was supported by examining many studies ((McQuail, 1968; Blumler, Cayrol, and Thoveron, 1978; Blumler, 1983 and McLeod et al., 2002) conducted on the effects of television on voters' political information during elections. Other studies for instance Trenaman and McQuail (1961) further showed that television proved its influential role by improving voters' campaign knowledge. According to Keeter (1987) voters rely heavily on television as compared to newspapers for campaign information. This situation was supported through the findings of Hendriks et al. (2004) who state that there is a positive relation between the frequency of citizens' consuming political content from the mass media, and the amount of their acquiring political knowledge from it.
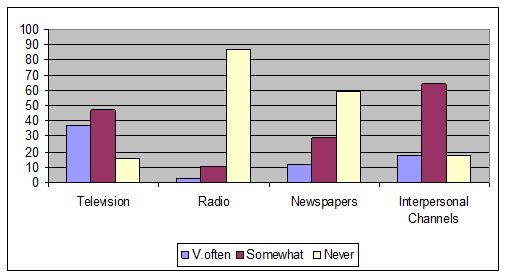
The findings in terms of people extent of interest in using various sources for political needs showed significant difference. They took more interest in watching television political news and views and also in discussing political matters through the use of interpersonal channels than the radio and newspapers' political contents (figure 1.1). Similarly, people's extent of satisfaction with these sources has been observed in line with their scores on the index of their extent of interest in using different sources for acquiring political information (figure 1.2).
The findings further illustrated that a significant majority of overall respondents, however, is of the view that its voting behavior is not at all influenced by radio (table 1.2). The findings of the study in terms of television's role in this respect show significant difference between urban respondents (39.3%) and those with high education (36%) who somewhat perceived television's role more important than their cross categories respectively. Moreover, there is very significant difference between rural residents (67.8%), respondents with low income (60.2%) and those with low education (56.7%) who never see the role of television in making their voting behavior as compared to their cross categories respectively. In case of radio, urban respondents (86.5%) significantly never perceive its role in making their voting behavior as compared to the rural respondents.
| Figure 1.1 |
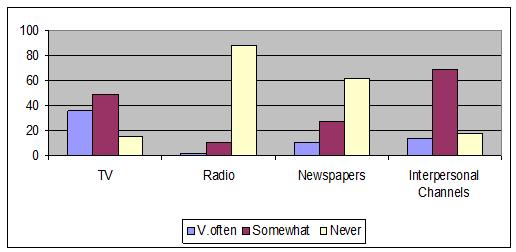 |
| Figure 1.2 |
 |
In case of newspapers, rural residents (86.5%) and respondents with low education (73.8%) significantly never perceive newspapers' role more important than their cross categories. In case of interpersonal channels, low age respondents (58.3%), males (50.8%), respondents belonging to rural areas (51.4%), those with low income (61.5% ) and respondents with low education (48.8%) somewhat significantly perceive interpersonal channels' role in influencing their voting behavior than their counter categories respectively (see table 1.2). On the basis of the observed empirical findings it can be concluded that the overall respondents and those belonging to different demographic groups are significantly of the view that television played major role in influencing their voting behavior followed by interpersonal channels. News papers, however, played a little role while radio played almost no role in this connection.
Table 1.2 Role of various sources in vote casting behavior
Overall |
Age |
Gender |
Location |
Income |
Education |
||||||
a* |
b |
c |
d |
e |
f |
g |
h |
i |
j |
||
Television |
|||||||||||
Very large** |
24.9 ^ |
31.3 |
23.2 |
26.5 |
22.6 |
39.3 |
11.8 |
26.6 |
28.1 |
20.7 |
36.0 |
Somewhat |
26.6 |
18.7 |
28.8 |
20.3 |
35.0 |
33.6 |
20.4 |
13.2 |
33.3 |
22.6 |
37.8 |
Not at all |
48.5 |
50.0 |
48.0 |
53.2 |
42.4 |
27.1 |
67.8 |
60.2 |
38.6 |
56.7 |
26.2 |
Radio |
|||||||||||
Very large |
05.8 |
06.3 |
05.7 |
07.1 |
04.1 |
05.6 |
05.9 |
07.2 |
03.5 |
05.5 |
06.5 |
Somewhat |
13.8 |
14.6 |
13.5 |
12.5 |
15.5 |
20.5 |
07.6 |
08.4 |
19.3 |
12.8 |
16.4 |
Not at all |
80.4 |
79.9 |
80.8 |
80.4 |
80.4 |
73.9 |
86.5 |
84.4 |
77.2 |
81.7 |
77.1 |
Newspaper |
|||||||||||
Very large |
11.1 |
08.3 |
11.8 |
15.6 |
05.2 |
18.7 |
04.2 |
16.8 |
07.0 |
08.5 |
18.0 |
Somewhat |
21.4 |
25.0 |
20.4 |
19.5 |
23.7 |
33.7 |
10.2 |
13.3 |
33.4 |
17.7 |
31.2 |
Not at all |
67.5 |
66.7 |
67.8 |
64.9 |
71.1 |
47.6 |
85.6 |
69.9 |
59.6 |
73.8 |
15.8 |
Interpersonal channels |
|||||||||||
Very large |
15.1 |
10.5 |
16.4 |
22.7 |
05.2 |
23.3 |
07.6 |
16.8 |
21.1 |
11.6 |
24.6 |
Somewhat |
45.3 |
58.3 |
41.8 |
50.8 |
38.1 |
36.5 |
51.4 |
61.5 |
38.5 |
48.8 |
36.1 |
Not at all |
39.5 |
31.2 |
41.8 |
26.6 |
56.7 |
40.2 |
39.0 |
21.7 |
40.4 |
39.6 |
39.4 |
N=225 48 177 128 97 107 118 83 57 164 61
*: a Low age b High age c Male d Female e Urban f Rural g Low income
h High income i Low education j High education.
**: very larger means very large and large, somewhat means somewhat and rarely, and not at all
refers to not at all and don't know.
^ : Figures in table show percentage.
The findings of the study in this regard extended full support to the hypothesis: it is more likely that the voters' political participation is influenced more from television as compared to the news papers '. The empirical findings were also found in line with many studies (Della, Vigna & Kaplan, 2006 and Gerber et al., 2007) exploring media's role in affecting voting behavior of the voters during elections. The findings of study of Lawson and McCann (2007) showed the significant effect of television on attitudes and vote choices. Similarly, Colton and McFaul (2003) emphasized the importance of media effects for the outcomes of Russian elections in 1999 and 2000 using a survey-based approach. After the review of the results, it was observed that television played major role in influencing the voting behavior of the respondents during elections 2008 as compared to the interpersonal channels, while newspapers and radio were far behind in influencing the voters' political participation . The findings of the study extended partial support to the hypothesis: it is more likely that interpersonal channels influence voters' political participation more than mass media political contents'. It was partially rejected as voters' political participation was influenced more by television as compared to interpersonal channels and partially accepted as the influence of interpersonal channels was far more as compared to newspapers and radio in this regard. The above discussed findings are supported by the findings of different studies on elections (Lazarsfeld et al. 1944; Berelson, Lazarsfeld, and McPhee, 1954; Sprague, 1995; Rogers, 2002a; and Huckfeld & Schmitt-Beck, 2003) which acknowledge the significance of interpersonal channels in attitudinal and behavioral changes among the audience members. Rogers (2002a) acknowledged the role of media as a source of stimulation for interpersonal communication about some issue, which then leads to behavioral change in the audience members.
Table 1.3 Role of various factors in vote casting behavior
Overall |
Age |
Gender |
Location |
Income |
Education |
||||||
a* |
b |
c |
d |
e |
f |
g |
h |
i |
j |
||
Ethnicity |
|||||||||||
Very often** |
14.2 ^ |
10.4 |
15.3 |
13.2 |
15.5 |
17.8 |
11.1 |
15.6 |
14.1 |
15.3 |
11.5 |
Somewhat |
48.0 |
58.3 |
45.2 |
56.3 |
37.1 |
35.5 |
59.3 |
62.7 |
45.6 |
48.8 |
45.8 |
Never |
37.8 |
31.3 |
39.5 |
30.5 |
47.4 |
46.7 |
29.6 |
21.7 |
40.3 |
35.9 |
42.7 |
Bradriism |
|||||||||||
Very large |
22.2 |
18.7 |
23.1 |
21.9 |
22.7 |
28.9 |
16.1 |
20.5 |
31.0 |
21.4 |
24.6 |
Somewhat |
51.6 |
54.2 |
50.9 |
56.3 |
45.3 |
41.2 |
61.1 |
61.4 |
52.6 |
53.6 |
45.9 |
Not at all |
26.2 |
27.1 |
26.0 |
21.8 |
32.0 |
29.9 |
22.8 |
18.1 |
26.4 |
25.0 |
29.5 |
Candidate personality |
|||||||||||
Very large |
35.1 |
33.3 |
35.6 |
35.2 |
35.1 |
43.9 |
27.1 |
28.9 |
42.1 |
32.9 |
41.0 |
Somewhat |
48.9 |
56.3 |
46.9 |
49.3 |
48.4 |
36.5 |
60.2 |
51.8 |
42.1 |
52.5 |
39.3 |
Not at all |
16.0 |
10.4 |
17.5 |
15.7 |
16.5 |
19.6 |
12.7 |
19.3 |
15.8 |
14.6 |
19.7 |
Party affiliation |
|||||||||||
Very large |
23.6 |
18.7 |
24.8 |
18.8 |
29.9 |
25.2 |
22.0 |
09.6 |
31.5 |
23.2 |
24.6 |
Somewhat |
33.3 |
37.5 |
32.3 |
28.9 |
39.2 |
31.7 |
34.7 |
29.0 |
26.3 |
35.4 |
27.9 |
Not at all |
43.1 |
43.8 |
42.9 |
52.3 |
30.9 |
43.1 |
4.3 |
61.4 |
42.2 |
41.4 |
47.5 |
Peer pressure |
|||||||||||
Very large |
08.0 |
06.3 |
08.5 |
07.8 |
08.3 |
09.4 |
06.7 |
03.6 |
17.5 |
07.3 |
09.8 |
Somewhat |
35.6 |
37.4 |
35.0 |
32.8 |
39.2 |
41.2 |
30.5 |
31.3 |
35.1 |
35.4 |
36.1 |
Not at all |
56.4 |
56.3 |
56.5 |
59.4 |
52.5 |
49.4 |
s 62.7 |
61.1 |
47.4 |
57.3 |
54.1 |
Community leaders |
|||||||||||
Very large |
05.3 |
06.3 |
05.1 |
06.2 |
04.1 |
06.5 |
04.2 |
04.8 |
08.8 |
04.8 |
06.6 |
Somewhat |
34.2 |
35.4 |
33.9 |
33.6 |
35.0 |
39.3 |
29.7 |
30.1 |
38.6 |
34.7 |
32.8 |
Not at all |
60.5 |
58.3 |
61.0 |
60.2 |
60.9 |
54.2 |
66.1 |
65.1 |
52.6 |
60.5 |
60.6 |
N=225 48 177 128 97 107 118 83 57 164 61
*: a Low age b High age c Male d Female e Urban f Rural g Low income
h High income i Low education j High education.
**: very larger means very large and large, somewhat means somewhat and rarely, and not at all
refers to not at all and don't know
^ : Figures in table show percentage.
To explore the role of various factors in influencing the voting behavior of the respondents during elections 2008, the findings of the study showed that the overall respondents significantly are of the view that candidate's personality played a major role in influencing voting behavior followed by biradriism , ethnicity and party affiliation respectively. However, peer pressure and community leaders could not play a significant role in this regard (see table 1.3). The comparison of the respondents' demographic characteristics in terms of respondent's perceptions about the role of ethnicity's in influencing voting behavior indicated that low age respondents (58.3%), males (56.3%), rural respondents (59.3%) and respondents with low income (62.7%) are somewhat significantly perceived ethnicity's role more important in this regard than their cross categories respectively. The respondents perception about the role of biradriism showed that males (56.3%) and respondents of rural areas (61.1%) consider somewhat role of beradrism, while urban respondents (43.9%) and those with high income (42.1%) very often significantly considered the role of candidate's personality; and respondents with high income (31.5%) very often significantly considered party affiliation; and rural respondents (62.7%) and those with high education (47.4%) never considered significant the role of peer pressure. However, rural residents (66%) and those with low income (65.1%) never considered significant role of community leader in influencing their voting behavior. On the basis of the observed empirical findings it can be concluded that the respondents are significantly of the view that candidate's personality played a major role in influencing their voting behavior followed by biradriism , ethnicity and party affiliation respectively. However, peer pressure and community leaders could not play a significant role in this regard .
To explore the role of various factors in abstaining the voters from casting their vote during elections 2008, the findings of the study revealed that overall respondents are of the view that mistrust on political system played a major role in abstaining them from casting their votes followed by threat of terrorist activities, absence of any reasonable candidate and polling station being away respectively (table 1.4). The comparative analysis of the respondents' demographic characteristics in this regard showed difference. Rural respondents (26.9%) & respondents with high education (33.3%) who very much while male respondents (43.7%) somewhat perceive the role of mistrust on political system in abstaining them from casting their votes as compared to their cross categories respectively. Males (25%), urban respondents (23.6%) and those with high education (25.9%) very much perceived the role of mentioned factors in abstaining them from casting their votes than their cross categories respectively. while low income (48.8%) significantly somewhat perceive the role of mentioned factors in abstaining them from casting their votes as compared to their cross categories respectively. Respondents with low income (43.9%) significantly somewhat consider the above mentioned factor in abstaining them from casting their votes. On the basis of observed empirical findings it can be concluded that the mistrust on political system played a major role in abstaining them from vote casting followed by threat of terrorist activities, absence of any reasonable candidate and factor of polling station being away from residence respectively.
Table 1.4 Role of various factors in abstaining from vote casting behavior
Overall |
Age |
Gender |
Location |
Income |
Education |
||||||
a* |
b |
c |
d |
e |
f |
g |
h |
i |
j |
||
Mistrust on political system |
|||||||||||
Very large** |
17.1 ^ |
17.7 |
16.7 |
31.9 |
06.8 |
26.9 |
06.1 |
22.0 |
12.5 |
10.0 |
33.3 |
Somewhat |
38.9 |
34.2 |
42.1 |
32.0 |
43.7 |
41.9 |
35.4 |
41.5 |
50.0 |
37.2 |
42.6 |
Not at all |
44.0 |
48.1 |
41.2 |
36.1 |
49.5 |
31.2 |
58.5 |
36.5 |
37.5 |
52.8 |
24.1 |
No reasonable candidate |
|||||||||||
Very large |
17.7 |
19.2 |
16.7 |
25.0 |
12.5 |
23.6 |
11.0 |
12.2 |
18.6 |
14.1 |
25.9 |
Somewhat |
32.6 |
30.1 |
34.3 |
29.1 |
35.0 |
32.3 |
33.0 |
43.9 |
31.3 |
29.7 |
38.9 |
Not at all |
49.7 |
50.7 |
49.1 |
45.9 |
52.5 |
44.1 |
56.0 |
43.9 |
50.1 |
56.2 |
35.2 |
Polling station was away |
|||||||||||
Very large |
09.2 |
08.3 |
09.8 |
11.1 |
07.8 |
08.6 |
09.8 |
14.6 |
09.3 |
08.3 |
11.2 |
Somewhat |
35.4 |
38.3 |
33.8 |
34.7 |
35.9 |
39.8 |
30.5 |
48.8 |
28.2 |
33.9 |
38.8 |
Not at all |
55.4 |
53.4 |
56.9 |
54.2 |
56.3 |
51.6 |
59.7 |
36.6 |
52.5 |
57.8 |
50.0 |
Threat of terrorist activities |
|||||||||||
Very large |
17.7 |
20.6 |
15.6 |
30.5 |
08.6 |
25.7 |
08.5 |
21.9 |
21.9 |
12.4 |
29.7 |
Somewhat |
33.1 |
28.7 |
36.2 |
29.2 |
36.0 |
29.1 |
37.8 |
43.9 |
11.9 |
33.1 |
33.3 |
Not at all |
49.2 |
50.7 |
48.2 |
40.3 |
55.4 |
45.2 |
53.7 |
34.2 |
56.3 |
54.5 |
37.0 |
N=175 73 102 72 103 93 82 41 32 121 54
*: a Low age b High age c Male d Female e Urban f Rural g Low income
h High income i Low education j High education.
**: very larger means very large and large, somewhat means somewhat and rarely, and not at all
refers to not at all and don't know.
^ : Figures in table show percentage.
The critical analysis of empirical evidence in terms of voters' time spending on different type of mass media political contents during election days and its effect on extent of acquiring political information showed a positive correlation. The analysis explored that the voters who spent more time on media political contents got more political information from these sources accordingly (Charts 1-2 & table 1.1). The study's findings in this regard extended full support to the research hypotheses: the more the voters' time spending on the type of mass media political content, then the more the likelihood of acquiring political information from these sources accordingly. The critical analysis of empirical evidence in terms of voters' extent of acquiring political information during election days and its effects on their political participation showed a positive correlation. The analysis explored that the voters who consumed more media political contents showed more political participation (tables 1.1). The study's findings in this regard fully supported the research hypotheses : the more the voters score on the index of consumption of media political content, then the more likelihood of their political participation '. The critically analysis of empirical evidence in terms of correlation of political interaction through interpersonal channels and political participation showed a positive correlation (see table 1.2) This condition extended full support to the research hypotheses: it is more likely that there are more chances of voters' political participation due to their more political interaction through interpersonal channels '. This correlation was further explored by comparing the use of interpersonal channels for political information in case of community leaders in table 1.3 and the role performed by them in vote casting behavior in table 1.4. The ratio of the responses of overall respondents with regards to the use of community leaders for acquiring political information was almost quite same as the ratio of the responses with regard to the role performed by them in vote casting behavior. It was further observed that overall respondents did not depend much on community leaders for acquiring political information and taking their voting decisions. This situation showed contradiction to many studies' findings conducted on elections which have shown very important role of the opinion/ community leaders with regard to influencing the voting behavior.
Critical review of the respondents' responses regarding the factors influencing their voting behavior revealed that candidate's personality was the major factor in this connection. Other important factors include bradriism , ethnicity and party affiliation played little role in terms of affecting voters' The analysis of the findings of the respondents, who did not cast their votes, revealed that mistrust on political system, threat of terrorist activities and the absence of any reasonable candidate the major obstacles behind the respondents not casting their votes. The respondents' perceptions about Pakistani media revealed that most of the respondents perceived Pakistani media to have party affiliations but they at the same time considered it as patriotic.
About the Authors
________________________________________________________________
Lecturer, Dept. of Communication studies, University of Sargodha
Prof./Chairman, Dept. of Communication Studies, University of Sargodha
Asstt. Prof. Dept. of Media Studies, The Islamia University of Bahawalpure
References
________________________________________________________________
Abbas, A. (2008, Feb12). Political democracy is not enough. Karach: Daily Dawn.
Ahmad, R. Z. (2002). Pakistan: The Real Picture. Karachi: Ferozsons (pvt.) Ltd.
Becker, P., & Raveloson, A. (2009). What is democracy? (Bachelor of Arts, Political Science, University of Hamburg ).
Berelson, B., Lazarsfeld P., & McPhee, W.N. (1954). Voting . New York : Free Press.
Blumler, J. G., & McLeod . J. M. (1974). Communication and voter turnout in Britian. In Legatt T. (Ed.), Sociological Theory and social research, 265-312. Beverly Hills , CA : Sage.
Blumler, J.G., & Gurevitch, M. (1995). The Crisis of Public Communication. New York : Routledge.
Campbell , A., Converse, P.E., Miller, W.E., & Stokes, D.E. (1960). The American Voter . New York : Wiley.
Campbell , A.et al. (1980). The American Voter . Chicago , Illinois : University Of Chicago Press.
Cappella, J.N., & Jamieson, H.K. (1996). News Frames, Political Cynicism and Media Cynicism. Political and Social Science , 546, 71-84.
Conovor, P. J., & Feldman, S. (1989). Candidate perception in an ambiguous world: Campaigns, cues and interference processes. American journal of political science, 33, 912-939.
Converse., & Philip E. (1964). The Nature of Belief Systems in Mass Publics. In D. Apter (Ed.), Ideology and Discontent . New York : Free Press, 206-61.
Cook, T.E. (1998). Governing with the News: The News Media as a Political Institution. Chicago : Chicago University Press.
Craig, Geofferey. (2007). The Media, Politics and public Life. Australia : Allen & Unwin.
Dearing, J.W., & Rogers , E.M. (1996). Agenda Setting. London : Sage.
Della, V. S., & E. Kaplan. (2007).The Fox News Effect: Media Bias and Voting. Quarterly Journal of Economics, 122.
Fazal, A. M. (2008, Feb.16). The transition from civil to military rule. Karachi : Daily Dawn.
Fazio, R. H., & Williams, C. J. (1986). Attitude accessibility as a moderator of the attitude perception and attitude behavior relations: An investigation of the 1984 presidential election. Journal of personality and social psychology, 51, 505-514.
Fishbein, M., & Ajzen, I. (1975), Belief , attitude, intention and behavior: An introduction to theory and research. Reading , MA : Addison Wesley.
Gerber, A., D. Karlan., & D. Bergan. (2007). Does the Media Matter? A Field Experiment.
Gilani , I. S. (2008). How elections are stolen and will of people defeated: Reflection on the Electoral History of Pakistan (1970- 2008). Lahore Gallup .
Gitlin, T. (1978). Media Sociology: The Dominant Paradigm. Theory and Society, 6, 05- 253.
Granberg, D., & Brown, T. A. (1989). On affect and cognition in politics. Social psychology quaterly, 52, 171-182.
Green, D., Alan G. (2004). Get Out the Vote . Washington D.C: Brookings Institution Press.
Green, D. P., Alan S. G., & David W. N. (2003). "Getting Out the Vote in Local Elections: Results from Six Door-to-Door Canvassing Experiments." Journal of Politics, 65, 1083-96.
Gunter, B. (1987). Poor reception: misunderstanding and forgetting broadcast news. Hillsdale , NJ : Erlbaum.
Hendriks,V. P. G. J., Hagemann, C. P. M., & Snippenburg, L. B.V. (2004). Political knowledge and media use in the Netherlands . European Sociological Review, 20 (5), 415-424.
Iyengar, S., & Kinder, D. (1987). News That Matters: Television and American Opinion . Chicago : University of Chicago Press.
Kennedy, P. J., & Tom W. R. (1987). Presidential Prenomination Preferences and Candidate
Evaluations. American Political Science Review, 82(4), 1309-1319.
Krosnick, J. A. (1988). The role of attitude importance in social evaluation: a study of policy preference, presidential candidate evaluations, and voting behavior. Journal of Personality and social psychology, 55, 196-210.
Lazarsfeld, P.F., Berelson, B., &Gaudet, H. (1944). The People's Choice: How the Voter Makes up His Mind in a Presidential Campaign. New York : Columbia University Press.
Lazarsfeld, P.F., Merton, R.K., & Bryson, L. (1948). The Communication of Ideas . New York : Harper and Row.
Lippmann, W. (1922). Public opinion . New York : Macmillan.
MacKuen, M. (1981). Social Communication and the Mass Policy Agenda. In. M.B. MacKuen., & S.L. Coombs (Eds.), More than News: Media Power in Public Affairs . Beverly Hills , CA : Sage.
McCombs, M., Shaw, D.L., & Weaver, D. (1997). Communication and Democracy: Exploring the Intellectual Frontiers of Agenda-setting Theory. Mahwah , NJ : Erlbaum.
McCombs , M.E. ,& D.L. Shaw. (1972). The Agenda-Setting Function of the Media. Public Opinion Quarterly, 36, 176-87.
McLeod, J. M., Becker, L. B., & Byrnes, J. E. (1974). Another look at the agenda setting function of the press. Communication research, 1, 131-165.
McLeod, J. M., Bybee, C. R., & Durall, J. A. (1979). The 1976 presidential debates and the equivalence of informed political participation. Communication research, 6, 463-487.
Moy, P., & Scheufele, D.A. (2000). Media Effects on Political and Social Trust. Journalism and Mass Communication Quarterly , 77(4), 744-759.
Murdock, G. (1990). Redrawing the map of the communications industries: concentration and ownership in the era of privatization. In M. Ferguson (Ed.), Public communication: the new imperatives future directions for media research (pp.115).
Murshid, M. (2008). The vicious cycle of extremism & Politics. Karachi : Daily Dawn.
Narula, U. (2006). Dynamics of Mass Communication: Theory and Practice. New Delhi : Atlantic Publishers.
Newhagen, J.E. (1994). Media Use and Political Efficacy: The Suburbanisation of Race and Class. Journal of the American Society for Information Science , 45(6), 386-394.
Nimmo, D. & Combs, J. (1983). Political Communication . , New York :Longman.
O'Keefe, G. J. (1985). Taking a bite out of crime: The impact of a public information campaign. Communication Research, 12, 147-178.
Petty, R.E., & Cacioppo, J.T. (1986). Communication and Persuasion: Central and Peripheral Routes to Attitude Change. New York : Springer-Verlag.
Pinkleton, B.E., Austin, E., & Fortman, K.K.J. (1998). Relationships of Media Use and Political Dissafection to Political Efficacy and Voting Behaviour. Journal of Broadcasting & Electronic Media, 42(1), 34-49.
Ranney, A. (1983). Channels of power. New York : Basic books.
Shafqat, S. (1998). Democracy in Pakistan : Value Change and Challenges of Institution Building . Westview Press.
Tipton, L. P., Haney, R. D. & Basehart, J. R. (1975). Media agenda-setting in city and state election campaigns. Journalism quarterly, 52, 15-22.
Waseem, M. (2006). Democratisation in Pakistan : A Study of the 2002 Elections. Karachi : Oxford University Press.
Worcester, R., & Mortimore, R. (2001). Explaining Labour's Second Landslide. London : Politico's Publishing .
Zaller, J.R. (1992). The Nature and Origins of Mass Opinion. Cambridge : University Press.
Copyright © 2011 Global Media Journal. All rights reserved.